
You could ask “how long can this go on” about a lot of things lately – Trump’s trials, Biden’s health, how long will false eyelashes (sorry, eyelash extensions) be in style? But what I have in mind is the incredible dominance of one part of the market.
Huge Variation in Returns
If you look at the following chart, you’ll see that for the past 1 year, 3 years, 5 years, even 10 years large growth stocks have outperformed everything else by a mile. The only thing close is large blend and that is mainly because a lot of large blend mutual funds have been massive buyers of large cap growth stocks like Nvidia, Amazon, Apple, Alphabet (Google), Microsoft, Tesla, Meta, Eli Lilly and others.
 The outperformance has been huge. Look at the first column of returns, the year-to-date returns. Large growth is up over 21% in just six months. Next best is large blend at 14% and then it drops off a cliff. Large value and the three mid-cap sectors are only up roughly 4-5%. Small stocks are up 3% at best and -2% at worst.
So, if you have been mainly in large growth stocks this year, you are ecstatic, but if you weren’t, it has been an average to poor year for you.
Look at the 3-year return column that includes 2022, a big down year. Large cap growth was up 11%/year while 4 of 9 categories lost money over 3 years. Another 3 of 9 categories averaged only 2-5%/year. Over the last three years, large growth has had 3-4X as much return of other parts of the market. That’s incredible!
Come on in the House
The concentration of returns gets even crazier. Why? If you are a mutual fund or hedge fund, do you want to stay in different parts of the market when those are getting crummy returns and large growth is getting huge returns? No, even if you are supposed to invest in value stocks or in mid or small stocks, you are going to find a way to get in on the action in large growth, however you justify it, or you end up looking bad and having your investors run away.
The thing is, the huge outperformance in large growth is even more concentrated in a handful of stocks called the Magnificent 7. In 2024 about 25% of mutual funds that buy large company stocks have more than 40% or more of their whole portfolio in just five companies, generally the same five companies. That is insane!
How unusual is that? Well, the average fund typically holds 100 or more stocks and generally has about 15% of that money in their top 5 stocks. Now a significant number has 40% or more in just five stocks. I typically don’t invest in funds that have 40% in their top 10 stocks because that is too concentrated. But I’ve seen that my large cap growth fund choices are now anywhere from 25% – 36% in their top 5 and that makes me nervous. When the pool gets too crowded the next thing is for people to get out.
Lesson from History
I have not seen concentration like that since the height of the tech bubble in 1999 when it seemed every fund in America was extremely over-invested in the same few big tech growth stocks. Like today, lots of inexperienced people thought making a lot of money in a short time was really easy and quit their jobs to do it full time at home or even borrowed money to invest in stocks.
As you may remember, that did not end well. The very tech-heavy NASDAQ 100 index lost almost -37% in 2000, -33% in 2001, and another -38% in 2002 for a total loss of 73% over roughly 2 ½ years. Many individual tech stocks lost even more. Those people all went back to work. Not as easy as they thought.
Value vs. Growth
Let’s look at it as value stocks vs. growth stocks. Contrary to what many people think, value stocks, that is the unloved, slower growing, lower priced stocks, have for many periods actually done better than fast-growing stocks. Why? It’s the old “buy low, sell high” theory. Buy what is unloved but fundamentally a good company and sell when it comes back into favor and goes higher.
In the chart below, purple is for value stocks and orange for growth. As you can see, during most of the period from about 1990 to 2020, value had better returns.
 You can also see that changes in which group does better typically occur in big market declines, but not always. One big exception is on this chart. It shows that growth stocks trailed value stocks for most of the 1990s, but then growth, mainly tech stocks, had a tremendous surge in 1998-1999.
It’s hard to see on this chart, but that’s when value took over again and beat growth from 2000 until the big market decline in 2008-09. Since value had gone up more, it came down more, but the bursting of the tech bubble in 1999 had left a long-lasting impression, and when stocks started up again in 2009, value kept the lead for another six years, for a total of 15 years of general outperformance.
It’s Getting Worse
Now look at the next chart. 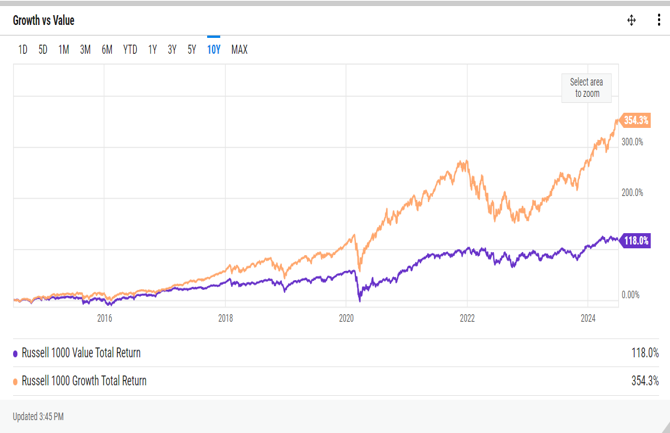 Here you can more clearly see growth start to outperform, and wow! Growth has left value in the dust since 2015, resulting in the widest gap I’ve ever seen in my 40 years of tracking this.
So, if you invested $100,000 in large value stocks in 2015, 10 years ago, you would now have $218,000. That’s an average annual return of 8.1%. But if you had invested that money in large growth, you would now have $454,000, a return of 16.3%/year. More than quadrupling your money in 10 years? That is amazing. And unsustainable.
Don’t feel bad if you weren’t on that ride. Very few people are willing to put all their eggs in one basket, being not only 100% in stocks, but 100% in one corner of the market, large growth stocks.
It’s Getting Worse
Now let’s look at this in 2024 in the last chart. So far this year, large growth stocks, shown here by the T. Rowe Price Large Cap Fund (purple line), are up 22.8%. The mainly large cap, value-oriented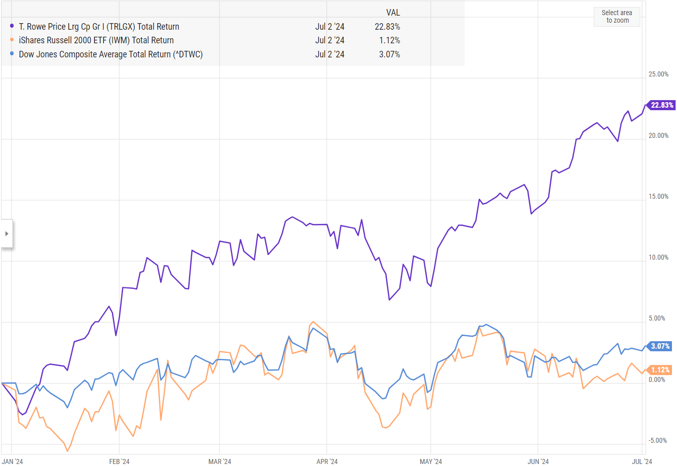 Dow Jones Industrial Average (blue line) is up just 3%, and the small stock index (orange line) is up 1%. Actually, since the end of February five months ago, the small stock index has a loss and the Dow is up 1%.
So far this year, investors in anything but the large cap growth stocks have made almost nothing while cap growth is up almost 24%. How long can this go on?
I can’t give you a definitive answer on that because there isn’t one, and trends on Wall St. tend to last a good bit longer than I think they should. I don’t know which of us that tells more about.
What Now?
You probably noticed that every time value got far ahead of growth or vice versa, they fell sharply in an overall market decline until they either restarted their outperformance (2008, 2020, 2022) or changed which one led afterwards (2000, 2015). Either way, leadership changed in market downturns. Generally, the bigger the decline, the longer lasting is the outperformance of the other group if it changes leadership.
What you should plan for then is for growth to fall much faster than value in the next market decline. You won’t be able to tell which will lead afterward unless the decline is devastating, like the one in 2000-02 when tech stocks fell 73% and people swore off ever investing in them again. People have shorter memories than they think they will, so “ever again” turned out to be 15 years for big tech stocks. If the decline is anything smaller, even the 50% decline in stocks in 2008-09, you may not see growth give up the crown.
When will that happen? No one can say, but I would counsel against going whole hog into large cap growth now. I still have it overweighted, but I recently decreased that overweight in many accounts and my next move will probably be to pull back more.