Because large losses are so damaging to long-term returns, market timing to avoid them has a lot of appeal.
It seems intuitively correct that when stock market indexes go to extremes they come back to normal and often swing the other direction before going back to a long-term trendline. So, can this be used to protect your portfolio by getting out when the S&P 500 Index goes to a very high level above its long-term moving average? It seems right, and if it is, that would be an important market timing tool to avoid sizable losses, thereby not only protecting your portfolio from losses, but increasing you overall total return.
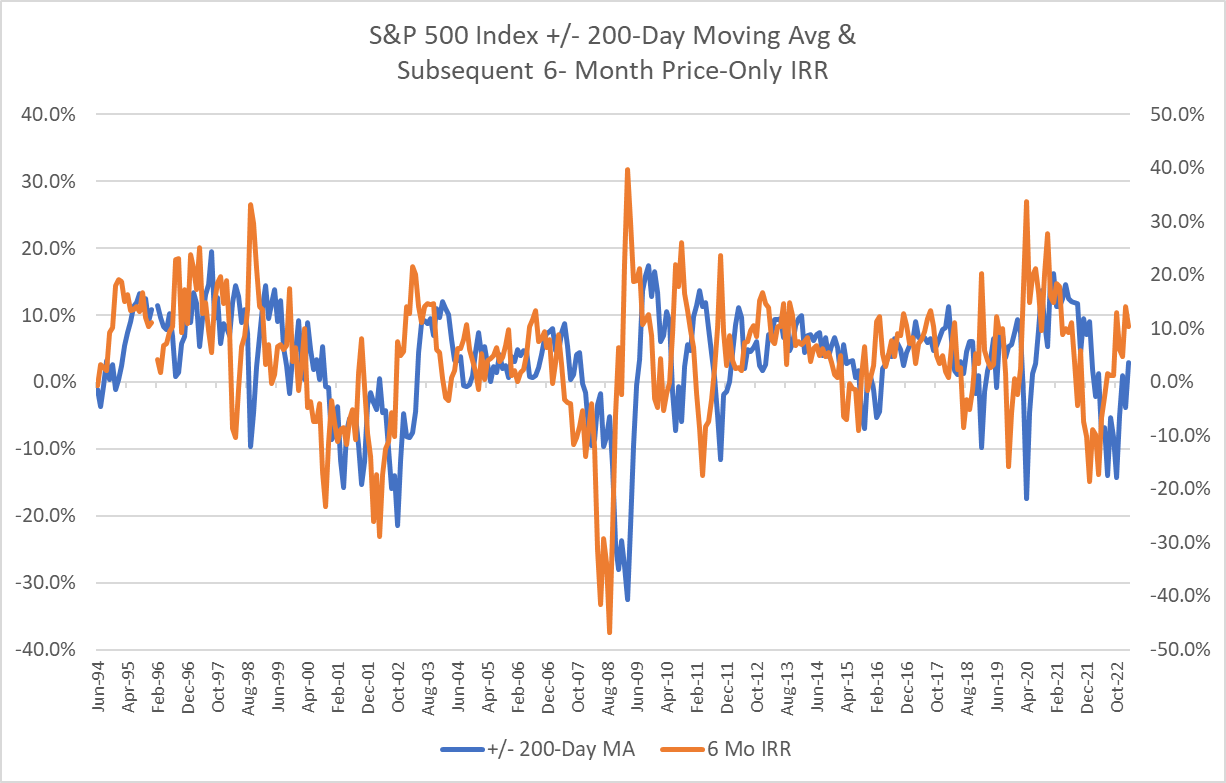
Looking at a chart of the S&P 500 Index over the past 30 years, you can see that the daily price sometimes gets more than 10% above the 200-day moving average and rarely gets to 15% or more above that average. You then see the daily price decline at some point, often as I said, dropping well below the 200-day moving average.
At first, it looks like turning points are easy to see and selling at the upper extremes looks like it pays off well.
So, I took the daily price of the S&P 500 and calculated at every day, both the percentage the daily price was above the 200-day moving average and secondly, what the 6-month return just based on the price difference and not adding dividends.
What I found was hard to believe. In fact, I kept checking my data to make sure what I found was correct.
First, I found that the correlation between the distance above or below the 200-day moving average and the price return six months later was only 7%, an extremely weak correlation.
Second, I found that in the last 30 years, there were 13 instances of the daily price being at least 13% above the 200-day long-term moving average, and many of these were weeks or months long. These occurred in 1995, 1996, 1997, 1998, 1999, 2003, 2004, 2009, 2011, 2013, 2020, and 2021.
Those 13 times amount to almost half of the last 30 years. Instances were as short as 2 days, averaged a few weeks, and went in some cases for months, making it difficult to use for market timing.
in the 13 instances in which the daily price was at least 13% above the 200-day moving average, only in 6 cases was there a loss 6 months later. If you had used that as a predictor of market losses six months later, you would have been wrong 7 times and right 6 times.
I also found that because the daily price often stayed above the long-term average price for weeks or months, so there was not a good, clear sell signal. You see, while the spikes look easy to identify on the chart, in practice, when you try to set a point at which to sell, you find that prices stay above the moving average for a while and the spikes can only be seen in retrospect, which is a bit like Google Maps telling you when you have missed your exit.
When the daily price was at least 13% above the average, how much it was above varied as it stayed up there. It might hit 15% or even more, then come back, but only by a few percent in many cases.
I could not find a number that was consistently predictive of losses six months later, not even 15%. In fact, the most extreme difference was 20.7% above the average and the 6-month return was 10.8%, not annualized, or 21.6% annualized plus the return from dividends, usually close to 2%.
What happened in many cases was that a strong advance just kept going and a person selling when the price got 10%, 12%, or even 15% above the long-term average lost out on very good gains.
Bottom line – used by itself, how far the price of the S&P 500 index is above the 200-day long-term moving average has no value as a timing signal to get out of the market and if used for that purpose, misses out on some of the index’s best returns.

