
Whether value or growth investing is the route to better client returns is an often-debated topic.
I was recently part of a team that interviewed investment advisors. Like many advisors, especially those who rely heavily on long-term studies and/or who come from an accounting rather than investment background, they were long-term, committed value investors. They rely on factor studies from firms like Dimensional Fund Advisors showing that value outperforms growth and that small stocks outperform large stocks. But are these true? It doesn’t seem so, because these value managers have been far down the list in performance, at least for the last 10 years. Are they missing something or is that just too short a time frame?
I also believe strongly in analyzing where outperformance and risk reduction come from and I routinely review the performance of my various accounts, looking for factors I can use to achieve consistent, risk-adjusted returns that outperform indexes and peers. So, let’s take a look at the returns from value or growth investing.
Old Market, New Market
It is true if you go back 100 or more years like the DFA studies do, that value has more often outperformed than growth. But most of that outperformance came in a different era, the era of Big Steel, Big Auto, Big Oil, primarily domestic manufacturing, rebuilding a war-ravaged world, basically the time before the Tech Age.
The start of the Tech Age is hard to pin down. It depends on whether you start with the innovations of the 1950s and 60s with television and companies like Polaroid, Xerox, IBM, the rise of the big drug companies and such, or whether you start with more widespread use of computers in the 1980s, the rise of personal computers, the internet, cell phones accompanied by the outsourcing of manufacturing around the world as the world became increasingly “flat.” That period was for many years, also the time of falling interest rates, decreasing inflation (both running from 1982 to 2021), women entering the workforce, rapidly expanding productivity, followed more recently by the increasingly flexibility of the workforce and now, the rise of artificial intelligence.
This has been an age of rapid innovation as well as the increasingly rapid adoption of revolutionary technology. Technology and information have exploded. I would argue that the early 1980s is a good place to mark the beginning. It was also the time of more widespread investing as the 401(k) and IRA provided vehicles for millions of Americans to invest systematically, providing more demand, i.e. fuel for the markets than ever before.
This has also been the time of my investment career that began in late 1984, so I have been around to witness this developing age. In this age that is now 40 or more years old, it has been growth that has been the more successful strategy as witness the chart below of the MSCI North American Growth and Value indices, chosen because they have the longest history in Morningstar. I have put this in log form. In linear form growth is currently far, far above the value line, but here we get a better year by year picture. I have also vertically stretched the graph for clarity.
Value vs. Growth in the Modern Era
From 1982 to 1989 growth and value were extremely close with no clear winner, but in 1989 growth became the top line until 2024, a period of 25 years, supplanted only by a small amount in 2006 and in the tech bubble bursting in 2000-2003. So, looking at the modern era, now roughly 40 years old, longer than most advisors’ careers, value (blue line below) has been the laggard, not the leader except for short periods.
Tech Bubble
The main period of underperformance for growth was after the bursting of the tech bubble of 1998-2000. The tech bubble was the most obvious bubble in the history of the U.S. stock market, even more so than 1929. The NASDAQ sported a monstrous 74 P/E in a strong economy and a 103% 1-year return from March 1999 to February 2000. Stocks were going public with no earnings and a 3-year life, and in months had market valuations greater than most blue-chip companies. People were quitting their jobs to become day traders and the tech allocation in the most popular funds like those from Janus reached 60-70% because the rest of the market topped out in summer 1998.
Any advisor that could not see that tech and large cap growth valuations had grown to dangerously extreme levels and either gotten out of stocks or at least rotated to value was not paying attention at all. I took most client money out of stocks in February 2000 and the portion remaining I put into value funds until becoming more diversified in 2002. Just using a 15% stop-loss would have avoided most of that fall.
Small Stocks Outperform – Not!
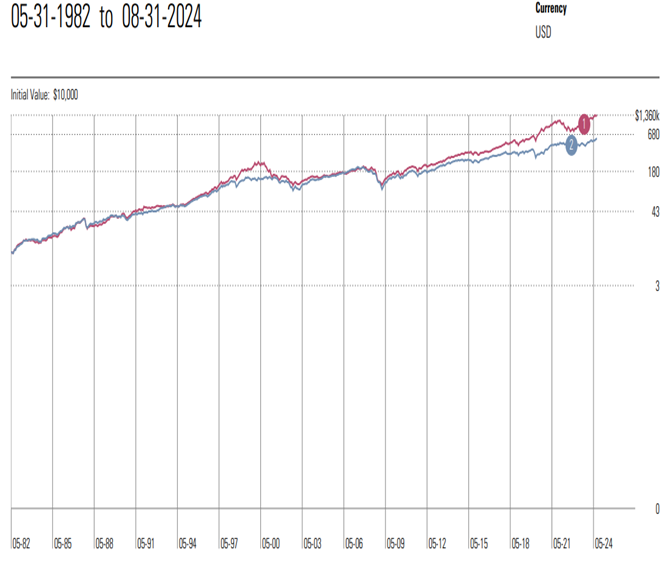
Another truism is that small stocks outperform large stocks. Well, again, let’s look at the 40+ year modern era and see how the S&P 500 performed vs. the Russell 2000 small stock index (red line below). There is no question that large stocks as represented by the cap-weighted S&P 500 (blue line) have outperformed small stocks.
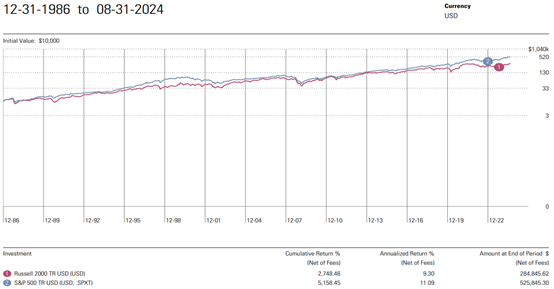
Now at first, it appears that maybe these lines are about the same if you start from the end of 1986. So, the second chart starts from that date and it is obvious that investing in small stocks has hurt rather than helped returns over the last four decades. Instead of adding 2% to returns as is widely assumed, they have actually underperformed by 1.79% per year.
International vs US
So let’s look now at the other prevalent idea for improving allocations, that of adding international exposure. That is also supposed to add returns.
Unfortunately, I could not find an index in Morningstar to represent international stocks that went back farther than 1992, so this only covers 32 years. It is also a hedged index so it takes out the effect of currency movement which can be significant, but since that is not the primary reason given for investing overseas, I think that is OK.
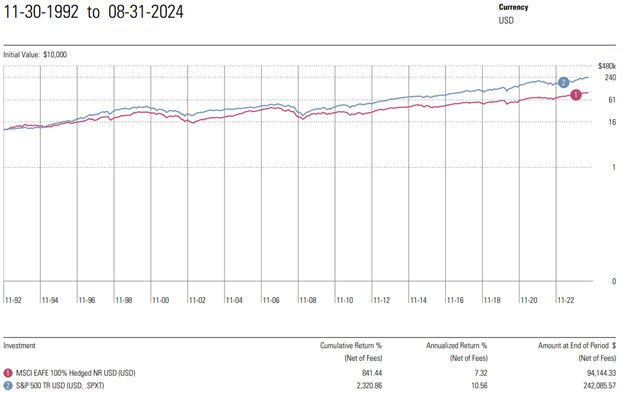
The results are pretty obvious. Except for one period from 2002-2007 when international stocks (red line) outperformed US stocks (blue line), it has been better to keep international stocks out. The cost to include them is even greater than small stocks and value stocks, with a drop in return of 3.24% vs the cost of value stocks at 2.18% and small stocks at 1.79% annually.
Looking Forward
One could say that the ships for value, small stocks, and international have just not come in yet. My answer would be “after 30-40 years?” They are more than just a little late, as much as a professional’s entire career.
One could argue that with the current state of the market there is a new bubble forming in the Magnificent Seven. I would say that is probably true, though the difference from the tech bubble is that this time revenue and earnings growth along with great consistency and predictability deserve high multiples. Nvidia, the highest performing of the group has a PEG ratio of less than 1.0.
But, looking at the last tech bubble, it only paid to underweight large growth for a couple years, not a professional lifetime. I contend that it is an argument for flexibility in allocations rather than a consistent value focus.
Risk
The last question is whether value is to be preferred because it is lower risk. Here I can’t look back very far. But over the last 15 years, the Sortino ratio of the MSCI North America Growth Index is 1.47 compared to its value counterpart with 1.02, the Russell 2000 at 0.87 and the MSCI EAFE 100% Hedged NR USD of 1.03. Higher is better on Sortino ratios and the growth index Sortino is significantly higher. The lower risk has been growth stocks, contrary to conventional wisdom. Growth stocks will pull back more in short-term corrections, but overall, they are actually less volatile.
Bottom Line
I have argued that the economic world is significantly different in the modern economy, which I think is best pegged in the early 1980s since so many significant economic and market influences had a roughly common beginning during that time. I have also argued that 40 years is more than enough time for factors to be considered long-term and worth evaluating for a professional advisor’s asset allocations. Looking back more than 40 years is to look at a different world. The world we have to invest in is not our grandfather’s or great-grandfather’s world. What worked then has not worked as well since.
I would also argue that is not what seems to work conceptually or what seems to be a disciplined, very tight, easily controlled system that is important, it is what works in terms of investment returns with reasonable risk. And although the indexes I could look at for risk only went back 15 years, I suspect that looking at the variability in the lines of each of the charts, that with the exception of an easily seen tech bubble 25 years ago, risk has been no greater and perhaps even less in growth investing over long periods of time. It certainly has been less the last 15 years as seen in Sortino ratios.
Style
There is no reason to dart in and out of value or growth, small or large, domestic or international allocations. These periods of outperformance have been multiyear and even multi-decade trends. It is best but not totally necessary to avoid a bubble on the order of the 2000-2001 tech bubble but that may be an exceedingly rare magnitude of bubble, challenged only by one 70 years earlier. I also don’t think it is necessary to go all in on growth, one can get by with overweighting growth, overweighting large cap and overweighting U.S. domestic stocks. However, it has been true for the last 30-40 years that doing the opposite has harmed investor returns and perhaps with no reduction in downside volatility.